Connecting Grafana to PostgreSQL with Python for Time Series Analysis

In the world of data analysis and graphs, we have three important tools: Grafana, PostgreSQL, and Python. They work together to help us look at data and track how it changes over time. In this article, we’ll learn step by step how to use Grafana with a PostgreSQL database. We’ll also discover how to use Python to record data that changes over time. By the end of this article, you’ll know how to set up these tools, and you’ll see how they can be useful for your work with data.

First, we create our table. We also create a sequence for the primary key.

CREATE TABLE MEASUREMENTLOG
(
    id              numeric(10)            NOT NULL,
    key             character varying(100) NOT NULL,
    datetime        TIMESTAMP WITHOUT TIME ZONE NOT NULL,
    status          numeric(2) NOT NULL,

    CONSTRAINT MEASUREMENTLOG_pkey PRIMARY KEY (id)
);

create sequence SEQ_MEASUREMENTLOG
    minvalue 0
    maxvalue 999999999999999999
    start with 1
    increment by 1
    cache 1;

And a simple python script to persists a timeseries.

from random import randint
from time import sleep
from datetime import datetime
import os
import logging
import pytz

from dbutils import transactional, get_conn

from settings import DSN

tz = pytz.timezone('Europe/Madrid')

logging.basicConfig(
    format='%(asctime)s [%(levelname)s] %(message)s',
    level='INFO',
    datefmt='%d/%m/%Y %X')

logger = logging.getLogger(__name__)


def persists(key, dt, status):
    with transactional(conn=get_conn(DSN)) as db:
        seq_log = db.fetch_all("SELECT nextval('seq_measurementlog')")[0][0]
        db.insert('measurementlog', dict(
            id=seq_log,
            key=key,
            datetime=dt,
            status=status
        ))


KEY = os.getenv('KEY')
status = 0
while True:
    now = datetime.now(tz)
    persists(
        key=KEY,
        dt=now,
        status=status
    )
    logger.info(f"[{now}] status: {status}")
    status = 1 if status == 0 else 0
    sleep(randint(5, 15))

Now we set up PostgreSQL database and Grafana in a docker-compose.yml.

More information about the configuration of postgresql and grafana here in the links

version: '3'

services:
  pg:
    image: pg
    restart: unless-stopped
    build:
      context: .docker/pg/
      dockerfile: Dockerfile
    environment:
      POSTGRES_PASSWORD: ${POSTGRES_PASSWORD}
      POSTGRES_USER: ${POSTGRES_USER}
      POSTGRES_DB: ${POSTGRES_DB}
      PGTZ: ${TIMEZONE}
      PGDATA: /var/lib/postgresql/data/pgdata
    ports:
      - "5432:5432"
  grafana:
    image: grafana
    restart: unless-stopped
    build:
      context: .docker/grafana/
      dockerfile: Dockerfile
    environment:
      - GF_TIMEZONE=${TIMEZONE}
      - GF_SECURITY_ADMIN_USER=${GF_SECURITY_ADMIN_USER}
      - GF_SECURITY_ADMIN_PASSWORD=${GF_SECURITY_ADMIN_PASSWORD}
      - GF_USERS_DEFAULT_THEME=${GF_USERS_DEFAULT_THEME}
      - GF_USERS_ALLOW_SIGN_UP=${GF_USERS_ALLOW_SIGN_UP}
      - GF_USERS_ALLOW_ORG_CREATE=${GF_USERS_ALLOW_ORG_CREATE}
      - GF_AUTH_ANONYMOUS_ENABLED=${GF_AUTH_ANONYMOUS_ENABLED}
    ports:
      - "3000:3000"
    depends_on:
      - pg

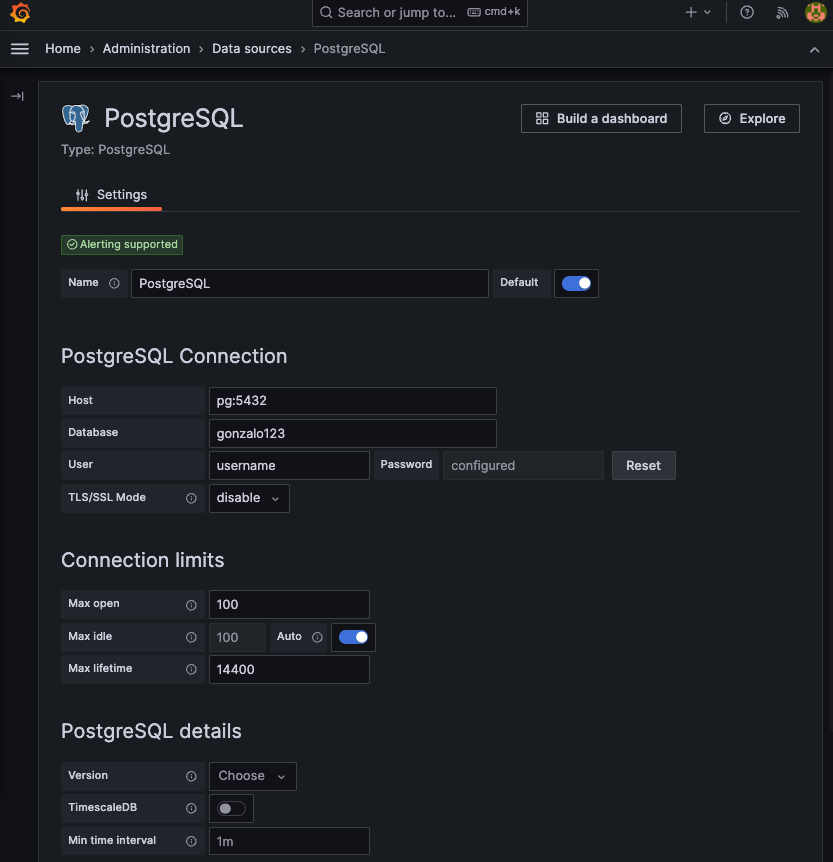
We run the stack, Connect the grafana at port 3000 and configure the datasource

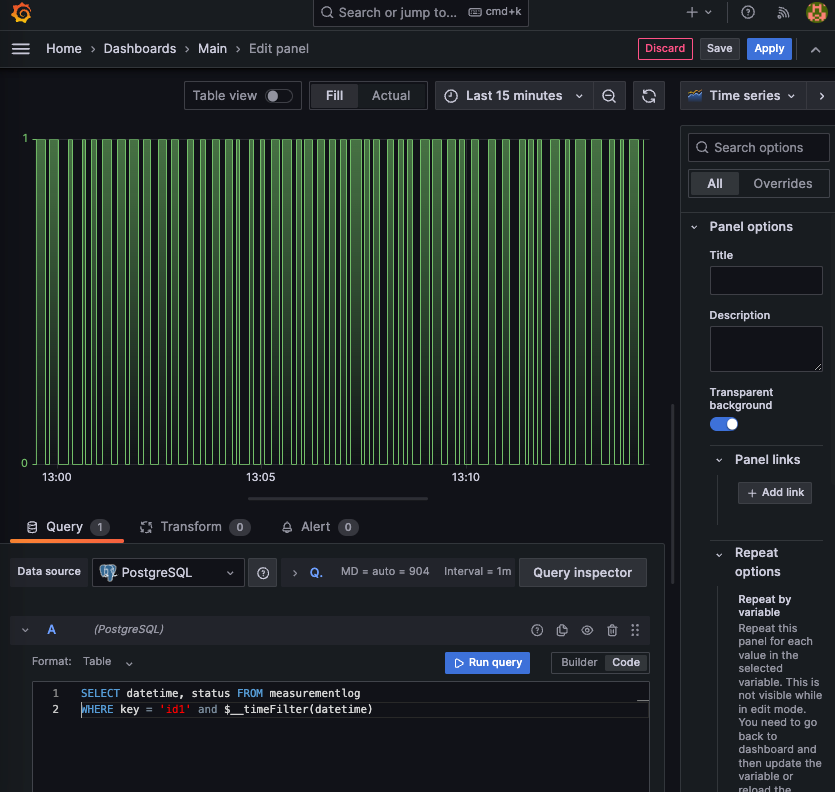
After that we can create the dashboard

We are using this query

SELECT 
    datetime, 
    status 
FROM 
    measurementlog 
WHERE 
    key = 'id1' and 
    $__timeFilter(datetime)

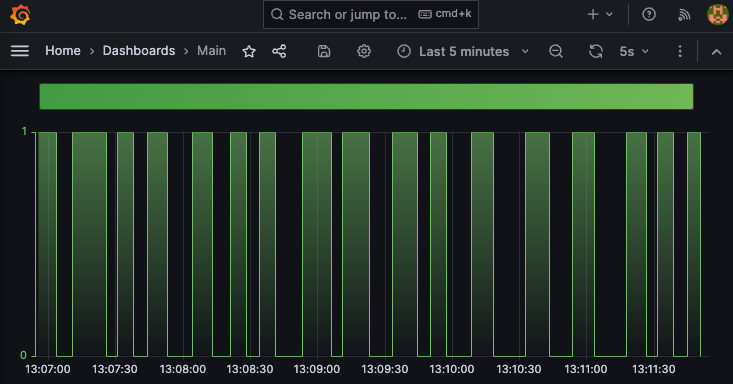
And that’s the dashboard

Proyect available in my github account.

Sending logs to AWS CloudWatch with a sidecar pattern and Python

In a Docker Swarm environment, the sidecar pattern is a common architectural approach used to extend the functionality of a primary container without directly modifying it.

First there’s a primary container. This is the main application or service you want to run within a Docker Swarm service. It’s responsible for the core functionality of your application. In our case, this container will be the log generator. It will save logs within a json format.

The sidecar container is a secondary container that runs alongside the primary container. It’s tightly coupled with the primary container and assists it by providing additional services or functionality. In our example, the sidecar responsibility will be push logs to AWS CloudWatch. The idea is sharing a docker volume between both containers. Whit this technique, our primary container will not be affected in network latency generating logs.

The idea is to generate something like this:

version: '3.6'

services:
  api:
    image: api:latest
    logging:
      options:
        max-size: 10m
    deploy:
      restart_policy:
        condition: any
    volumes:
      - logs_volume:/src/logs
    environment:
      - ENVIRONMENT=production
      - PROCESS_ID=api
    ports:
      - 5000:5000
    command: gunicorn -w 1 app:app -b 0.0.0.0:5000 --timeout 180

  filebeat:
    image: cw:production
    command: bash -c "python cw.py && sleep 1m"
    deploy:
      restart_policy:
        condition: any
    environment:
      - LOG_GROUP=python_logs_example
      - LOG_STREAM_PREFIX=default
    volumes:
      - logs_volume:/src/logs
volumes:
  logs_volume:

Let’s go. First, we need to setup our aws credentials. We can use a profile or a IAM user

if AWS_PROFILE_NAME:
    session = boto3.Session(profile_name=AWS_PROFILE_NAME, region_name=AWS_REGION)
else:
    session = boto3.Session(
        aws_access_key_id=AWS_ACCESS_KEY_ID,
        aws_secret_access_key=AWS_SECRET_ACCESS_KEY,
        region_name=AWS_REGION)

logs = session. Client('logs')

then we need to setup the logGroup and logStream in CloudWatch. We can generate them by hand, but I preffer to generate them programatically, if they don’t exist.

def init_cloudwatch_stream():
    log_stream_name = f"{LOG_STREAM_PREFIX}_{datetime.now().strftime('%Y%m%d')}"

    log_groups = logs.describe_log_groups(logGroupNamePrefix=LOG_GROUP)['logGroups']
    if not any(group['logGroupName'] == LOG_GROUP for group in log_groups):
        logs.create_log_group(logGroupName=LOG_GROUP)

    log_streams = logs.describe_log_streams(
        logGroupName=LOG_GROUP,
        logStreamNamePrefix=log_stream_name
    )['logStreams']

    if not any(stream['logStreamName'] == log_stream_name for stream in log_streams):
        logs.create_log_stream(logGroupName=LOG_GROUP, logStreamName=log_stream_name)

    return log_stream_name

Now we need to upload logs to CloudWatch. We need to use put_log_events. To send multiple logs we need to use a sequenceToken (not the first time). To do that I use this trick.

function_parameters = dict(
    logGroupName=LOG_GROUP,
    logStreamName=log_stream_name
)

for f in glob(f'{LOG_PATH}/*.{LOG_EXTENSION}'):
    function_parameters['logEvents'] = get_log_events_from_file(f)
    response = logs.put_log_events(**function_parameters)
    function_parameters['sequenceToken'] = response['nextSequenceToken']

We also need to read log files and maybe change the fields according to your needs

def get_log_events_from_file(file):
    exclude_fields = ('@timestamp', 'logger')
    return [
        dict(
            timestamp=int(datetime.fromisoformat(d['@timestamp']).timestamp() * 1000),
            message=json.dumps({k: v for k, v in d.items() if k not in exclude_fields})
        ) for d in [json.loads(linea) for linea in open(file, 'r')]]

I like to have all the settings of my application in a file called settings.py. It’s a pattern that I’ve copied from Django. In this file also I read environment variables from a dotenv file.

import os
from pathlib import Path

from dotenv import load_dotenv

BASE_DIR = Path(__file__).resolve().parent
ENVIRONMENT = os.getenv('ENVIRONMENT', 'local')

load_dotenv(dotenv_path=Path(BASE_DIR).resolve().joinpath('env', ENVIRONMENT, '.env'))

AWS_ACCESS_KEY_ID = os.getenv('AWS_ACCESS_KEY_ID')
AWS_SECRET_ACCESS_KEY = os.getenv('AWS_SECRET_ACCESS_KEY')

AWS_PROFILE_NAME = os.getenv('AWS_PROFILE_NAME', False)
AWS_REGION = os.getenv('AWS_REGION')

LOG_GROUP = os.getenv('LOG_GROUP', 'python_logs_example')
LOG_STREAM_PREFIX = os.getenv('LOG_STREAM_PREFIX', 'default')

LOG_EXTENSION = 'log'
LOG_PATH = os.getenv('LOG_PATH', Path(BASE_DIR).resolve())

And that’s all. Your logs in CloudWatch uploaded in a background process decoupled from the main process.

Source code available in my github.

Real-time Object Detection and Streaming with Python, OpenCV, AWS Kinesis, and YOLOv8

I’ve got the following idea in my mind. I want to detect objects with YoloV8 and OpenCV. Here a simple example:

import cv2 as cv
from ultralytics import YOLO
import logging

logging.getLogger("ultralytics").setLevel(logging.WARNING)

logging.basicConfig(
    format='%(asctime)s [%(levelname)s] %(message)s',
    level='INFO',
    datefmt='%d/%m/%Y %X')

logger = logging.getLogger(__name__)

X_RESIZE = 800
Y_RESIZE = 450

YOLO_MODEL="yolov8m.pt"
YOLO_CLASSES_TO_DETECT = 'bottle',
THRESHOLD = 0.80

cap = cv.VideoCapture(0)
model = YOLO(YOLO_MODEL)
while True:
    _, original_frame = cap.read()
    frame = cv.resize(original_frame, (X_RESIZE, Y_RESIZE), interpolation=cv.INTER_LINEAR)

    results = model.predict(frame)

    color = (0, 255, 0)
    for result in results:
        for box in result.boxes:
            class_id = result.names[box.cls[0].item()]
            status = id == class_id
            cords = box.xyxy[0].tolist()
            probability = round(box.conf[0].item(), 2)

            if probability > THRESHOLD and class_id in YOLO_CLASSES_TO_DETECT:
                logger.info(f"{class_id} {round(probability * 100)}%")
                x1, y1, x2, y2 = [round(x) for x in cords]
                cv.rectangle(frame, (x1, y1), (x2, y2), color, 2)

    cv.imshow(f"Cam", frame)

    if cv.waitKey(1) & 0xFF == ord('q'):
        break

cap.release()
cv.destroyAllWindows()

However, my idea is slightly different. I intend to capture the camera stream, transmit it to AWS Kinesis, and subsequently, within a separate process, ingest this Kinesis stream for object detection or any other purpose using the camera frames. To achieve this, our initial step is to publish our OpenCV frames into Kinesis. producer.py

import logging

from lib.video import kinesis_producer
from settings import KINESIS_STREAM_NAME, CAM_URI, WIDTH

logging.basicConfig(
    format='%(asctime)s [%(levelname)s] %(message)s',
    level='INFO',
    datefmt='%d/%m/%Y %X')

logger = logging.getLogger(__name__)

if __name__ == '__main__':
    kinesis_producer(
        kinesis_stream_name=KINESIS_STREAM_NAME,
        cam_uri=CAM_URI,
        width=WIDTH
    )
def kinesis_producer(kinesis_stream_name, cam_uri, width):
    logger.info(f"start emitting stream from cam={cam_uri} to kinesis")
    kinesis = aws_get_service('kinesis')
    cap = cv.VideoCapture(cam_uri)
    try:
        while True:
            ret, frame = cap.read()
            if ret:
                scale = width / frame.shape[1]
                height = int(frame.shape[0] * scale)

                scaled_frame = cv.resize(frame, (width, height))
                _, img_encoded = cv.imencode('.jpg', scaled_frame)
                kinesis.put_record(
                    StreamName=kinesis_stream_name,
                    Data=img_encoded.tobytes(),
                    PartitionKey='1'
                )

    except KeyboardInterrupt:
        cap.release()

Now our consumer.py

import logging

from lib.video import kinesis_consumer
from settings import KINESIS_STREAM_NAME

logging.getLogger("ultralytics").setLevel(logging.WARNING)

logging.basicConfig(
    format='%(asctime)s [%(levelname)s] %(message)s',
    level='INFO',
    datefmt='%d/%m/%Y %X')

logger = logging.getLogger(__name__)

if __name__ == '__main__':
    kinesis_consumer(
        kinesis_stream_name=KINESIS_STREAM_NAME
    )

To get the frames from kinesis stream we need to consider the shards. According to your needs you should change it a little bit.

def kinesis_consumer(kinesis_stream_name):
    logger.info(f"start reading kinesis stream from={kinesis_stream_name}")
    kinesis = aws_get_service('kinesis')
    model = YOLO(YOLO_MODEL)
    response = kinesis.describe_stream(StreamName=kinesis_stream_name)
    shard_id = response['StreamDescription']['Shards'][0]['ShardId']
    while True:
        shard_iterator_response = kinesis.get_shard_iterator(
            StreamName=kinesis_stream_name,
            ShardId=shard_id,
            ShardIteratorType='LATEST'
        )
        shard_iterator = shard_iterator_response['ShardIterator']
        response = kinesis.get_records(
            ShardIterator=shard_iterator,
            Limit=10
        )

        for record in response['Records']:
            image_data = record['Data']
            frame = cv.imdecode(np.frombuffer(image_data, np.uint8), cv.IMREAD_COLOR)
            results = model.predict(frame)
            if detect_id_in_results(results):
                logger.info('Detected')

def detect_id_in_results(results):
    status = False
    for result in results:
        for box in result.boxes:
            class_id = result.names[box.cls[0].item()]
            probability = round(box.conf[0].item(), 2)
            if probability > THRESHOLD and class_id in YOLO_CLASSES_TO_DETECT:
                status = True
    return status

And that’s all. Real-time Object Detection with Kinesis stream. However, computer vision examples are often simple and quite straightforward. On the other hand, real-world computer vision projects tend to be more intricate, involving considerations such as cameras, lighting conditions, performance optimization, and accuracy. But remember, this is just an example.

Full code in my github.

AWS SQS 2 HTTP server with Python

Simple service that listens to a sqs queue and bypass the payload to a http server, sending a POST request with the SQS’s payload and a Bearer Token.

The main script read a .env file with the aws credentials and http endpoint.

# AWS CREDENTIALS
AWS_ACCESS_KEY_ID=xxx
AWS_SECRET_ACCESS_KEY=xxx
AWS_REGION=eu-west-1
#AWS_PROFILE=xxx
# SQS
SQS_QUEUE_URL=https://sqs.eu-west-1.amazonaws.com/xxx/name
# REST ENDPOINT
HTTP_ENDPOINT=http://localhost:5555
AUTH_BEARER_TOKEN=xxx
import logging

from dotenv import load_dotenv, find_dotenv

_ = load_dotenv(find_dotenv())

from lib.sqs2http import loop_step, get_sqs

for library in ['botocore', 'boto3']:
    logging.getLogger(library).setLevel(logging.WARNING)

logging.basicConfig(
    format='%(asctime)s [%(levelname)s] %(message)s',
    level='INFO',
    datefmt='%d/%m/%Y %X'
)

logger = logging.getLogger(__name__)

if __name__ == "__main__":
    logger.info("sqs2http start")
    sqs = get_sqs()
    while True:
        loop_step(sqs)

The main loop is like this:

def loop_step(sqs):
    response = sqs.receive_message(
        QueueUrl=SQS_QUEUE_URL,
        MaxNumberOfMessages=SQS_MAX_NUMBER_OF_MESSAGES)

    if 'Messages' in response:
        for message in response.get('Messages', []):
            try:
                body = message.get('Body')
                logger.info(body)
                do_post(body)
                remove_from_sqs(sqs, message.get('ReceiptHandle'))

            except Exception as e:
                logger. Exception(e)

To post to the http server we can use requests.

import requests
import json

from settings import HTTP_ENDPOINT, AUTH_BEARER_TOKEN

def do_post(body):
    requests.post(
        url=HTTP_ENDPOINT,
        data=json.dumps(body),
        headers={
            'Authorization': AUTH_BEARER_TOKEN,
            'Content-Type': 'application/json'
        })

With this simple script you can set up a web server that process all incoming SQS messages. Source code in my github.

Deploying Python Applications in a Docker Swarm Cluster with Traefik Reverse Proxy and HTTPS

In this article, we will explore the process of deploying Python applications in a Docker Swarm cluster, utilizing a Traefik reverse proxy and ensuring secure communication through HTTPS. By following this approach, we can enhance the scalability, availability, and security of our Python applications.

HTTP is not a secure protocol. When deploying a web service using HTTP, it is important to be aware that anyone can intercept the traffic between the browser and the server. An attacker simply needs to use a sniffer tool like Wireshark, for example, to view the traffic in plain text, including passwords and sensitive data. The solution to this issue is to use the HTTPS protocol. HTTPS provides two important benefits: first, it ensures that the server is who it claims to be through certificates, and second, it encrypts the traffic between the client and server. When exposing anything to the internet, the use of HTTPS is considered mandatory. However, in some cases, such as internal APIs within a local network, HTTPS may not be utilized. In this article, we will focus on enabling HTTPS for services in a Docker Swarm cluster. Let’s get started.

To achieve this, we will utilize Traefik as a reverse proxy, serving as the sole entry point for our services deployed within the Swarm cluster. Our deployed stacks will not directly expose any ports outside the cluster; instead, they will be mapped to Traefik. Traefik will then handle the task of exposing these services on specific paths. To establish this setup, both our stacks and Traefik will utilize the same external network. Therefore, the first step is to define this network within our cluster.

docker network create --driver overlay external-net

That’s our Traefik service configuration

version: "3.9"

services:
  traefik:
    image: traefik:v2.10
    command:
      - "--log.level=INFO"
      - "--api.insecure=false"
      - "--api=true"
      - "--api.dashboard=true"
      - "--providers.docker=true"
      - "--providers.docker.exposedByDefault=false"
      - "--entrypoints.web.address=:80"
      - "--entrypoints.websecure.address=:443"
      - "--entrypoints.web.http.redirections.entryPoint.to=websecure"
      - "--entrypoints.web.http.redirections.entryPoint.scheme=https"
    environment:
      - TZ=Europe/Madrid
    ports:
      - "80:80"
      - "443:443"
    volumes:
      - "/var/run/docker.sock:/var/run/docker.sock:ro"

    networks:
      - external-net

networks:
  external-net:
    external: true

Now, let’s define our service. In this example, we will have three replicas of a Flask API backend behind a Nginx proxy, which is a common Python scenario.

from flask import Flask
import os

app = Flask(__name__)


@app.get("/service1")
def health():
    return dict(
        status=True,
        slot=os.getenv('SLOT')
    )

And that’s the configuration of the service:

version: '3.9'

services:
  nginx:
    image: flaskdemo_nginx:latest
    labels:
      - "traefik.enable=true"
      - "traefik.http.routers.app.tls=true"
      - "traefik.http.routers.app.rule=PathPrefix(`/service1`)"
      - "traefik.http.services.app.loadbalancer.server.port=80"
    depends_on:
      - backend
    networks:
      - external-net
      - default-net

  backend:
    image: flaskdemo:latest
    command: gunicorn -w 1 app:app -b 0.0.0.0:5000 --timeout 180
    environment:
      SLOT: "{{.Task.Slot}}"
    deploy:
      replicas: 3
    networks:
      - default-net

networks:
  default-net:
  external-net:
    external: true

It uses two images, one for the Flask backend. As we can see in the Dockerfile, we are utilizing a Python 3.11 base image. In the Dockerfile, we set up a non-root user, configure the container, and install dependencies using Poetry.

FROM python:3.11 AS base

ENV PYTHONDONTWRITEBYTECODE 1
ENV PYTHONUNBUFFERED 1
ENV APP_HOME=/src
ENV APP_USER=appuser

RUN groupadd -r $APP_USER && \
    useradd -r -g $APP_USER -d $APP_HOME -s /sbin/nologin -c "Docker image user" $APP_USER

ENV TZ 'Europe/Madrid'
RUN echo $TZ > /etc/timezone && \
    apt-get update && apt-get install --no-install-recommends -y tzdata && \
    rm /etc/localtime && \
    ln -snf /usr/share/zoneinfo/$TZ /etc/localtime && \
    dpkg-reconfigure -f noninteractive tzdata && \
    apt-get clean

RUN pip install --upgrade pip poetry

FROM base

WORKDIR $APP_HOME
COPY --chown=$APP_USER:$APP_USER pyproject.toml poetry.lock ./

RUN poetry config virtualenvs.create false && \
    poetry install --no-root --no-interaction --no-ansi --no-dev

COPY --chown=$APP_USER:$APP_USER src $APP_HOME
RUN find "$APP_HOME" -name '__pycache__' -type d -exec rm -r {} +

RUN chown -R $APP_USER:$APP_USER $APP_HOME

USER $APP_USER

We also have a Nginx proxy that serves the replicas of the backend.

upstream loadbalancer {
    server backend:5000;
}

server {
    server_tokens off;
    client_max_body_size 20M;
    proxy_busy_buffers_size   512k;
    proxy_buffers   4 512k;
    proxy_buffer_size   256k;
    proxy_set_header Host $host;
    add_header X-Frame-Options SAMEORIGIN;
    real_ip_header X-Forwarded-For;
    real_ip_recursive on;
    set_real_ip_from 0.0.0.0/0;
    proxy_read_timeout 300;
    proxy_connect_timeout 300;
    proxy_send_timeout 300;

    location /service1 {
        proxy_pass http://loadbalancer;
    }

    location /service1/health {
        default_type text/html;
        access_log off;
        return 200 'Ok!';
    }
}
FROM nginx:1.23.4-alpine-slim

RUN rm /etc/nginx/conf.d/default.conf
COPY nginx.conf /etc/nginx/conf.d

With those two containers we can set up the service

version: '3.8'

services:
  nginx:
    image: flaskdemo_nginx:latest
    labels:
      - "traefik.enable=true"
      - "traefik.http.routers.app.tls=true"
      - "traefik.http.routers.app.rule=PathPrefix(`/service1`)"
      - "traefik.http.services.app.loadbalancer.server.port=80"
    depends_on:
      - backend
    networks:
      - external-net
      - default-net

  backend:
    image: flaskdemo:latest
    command: gunicorn -w 1 app:app -b 0.0.0.0:5000 --timeout 180
    environment:
      SLOT: "{{.Task.Slot}}"
    deploy:
      replicas: 3
    networks:
      - default-net

networks:
  default-net:
  external-net:
    external: true

As we can observe, the magic of Traefik lies within the labels assigned to the exposed service, which in our case is Nginx. These labels define the path that Traefik will utilize to serve the service, specified as “/service1” in our example. Additionally, we instruct Traefik to use HTTPS for this service. It is crucial to ensure that our exposed Nginx service is placed within the same external network as Traefik, as demonstrated by the “external-net” in our example.

On the other hand, the backend service, represented by our Flask application, does not necessarily need to reside in this network. In fact, it is preferable to segregate our service networks, utilizing a private non-external network, such as the “default-net,” to establish communication solely between Nginx and the backend.

Note: With this configuration, we are utilizing the default HTTPS certificate provided by Traefik. It should be noted that this certificate does not guarantee server authority, which may result in browser warnings. However, it does ensure that the traffic is encrypted. Alternatively, there are other options available such as using a self-signed certificate, purchasing a certificate from a certificate authority, or obtaining a free valid certificate from Let’s Encrypt. However, these alternatives are beyond the scope of this post.

Now ce can build our containers

docker build -t flaskdemo .
docker build -t flaskdemo_nginx .docker/nginx

and deploy to our Swarm cluster (in my example at localhost)

docker stack deploy -c traefik-stack.yml traefik
docker stack deploy -c service-stack.yml service1

And that’s it! Our private API is now up and running, utilizing HTTPS for secure communication. Full code in my github.
Flask api skeleton to handle PostgreSQL operations

That’s a boilerplate for an api server using Flask. The idea is one api server to work as backend server to handle all database operations. The api server will handle only POST requests and the input parameters will be on the body of the payload as JSON. I know that it isn’t a pure REST server but that’s what I need.

To organize better the api we`ll set a group of modules using Flask’s blueprints. The entry point of the application will be app.py file

import logging

from flask import Flask
from flask_compress import Compress

from lib.logger import setup_logging
from lib.utils import CustomJSONEncoder
from modules.example import blueprint as example
from settings import LOG_LEVEL, ELK_APP, ELK_INDEX, ELK_PROCESS, LOG_PATH

logging.basicConfig(level=LOG_LEVEL)

setup_logging(app=ELK_APP,
              index=ELK_INDEX,
              process=ELK_PROCESS,
              log_path=LOG_PATH)

app = Flask(__name__)
app.json_encoder = CustomJSONEncoder
compress = Compress()
compress.init_app(app)

app.register_blueprint(example)

All application configuration is in settings.py file. I borrowed this pattern from Django applications. All my configuration is in this file and the particularities of the environment are loaded from dotenv files in settings.py

import os
from logging import INFO
from pathlib import Path

from dotenv import load_dotenv

BASE_DIR = Path(__file__).resolve().parent

APP_ID = 'dbapi'
APP_PATH = 'dbapi'
ENVIRONMENT = os.getenv('ENVIRONMENT', 'local')

load_dotenv(dotenv_path=Path(BASE_DIR).resolve().joinpath('env', ENVIRONMENT, '.env'))

PROCESS_ID = os.getenv('PROCESS_ID', APP_ID)
LOG_LEVEL = os.getenv('LOG_LEVEL', INFO)
ELK_APP = f'{APP_ID}.{PROCESS_ID}'
ELK_INDEX = f'{APP_ID}_{ENVIRONMENT}'
ELK_PROCESS = APP_ID
LOG_PATH = f'./logs/{APP_ID}.log'

BEARER = os.getenv('BEARER')

# Database configuration
DEFAULT = 'default'

DATABASES = {
    DEFAULT: f"dbname='{os.getenv('DEFAULT_DB_NAME')}' user='{os.getenv('DEFAULT_DB_USER')}' host='{os.getenv('DEFAULT_DB_HOST')}' password='{os.getenv('DEFAULT_DB_PASS')}' port='{os.getenv('DEFAULT_DB_PORT')}'"
}

In this example we’re using one blueprint called example. I register blueprints manually. The blueprint has a set or routes. Those routes are within routes.py file:

from .actions import foo, bar

routes = [
    dict(route='', action=lambda: True),
    dict(route='foo', action=foo),
    dict(route='bar', action=bar),
]

Here we map url path to actions. For example, foo action is like that

from datetime import datetime

from lib.decorators import use_schema
from .schemas import FooSchema


@use_schema(FooSchema)
def foo(name, email=False):
    now = datetime.now()
    return dict(name=name, email=email, time=now)

To validate user input, we’re using schemas (using marshmallow library). In this example our validation schema is:

from marshmallow import fields, Schema


class FooSchema(Schema):
    name = fields.String(required=True)
    email = fields.Email(required=False)

We’re hiding Flask infrastructure path in module’s __init__.py file

import os

from flask import Blueprint

from lib.auth import authorize_bearer
from lib.utils import call_action, get_response
from settings import BEARER
from .routes import routes

NAME = os.path.basename(os.path.dirname(__file__))
blueprint = Blueprint(NAME, __name__, url_prefix=f'/{NAME}')


@authorize_bearer(bearer=BEARER)
@blueprint.post('/')
@blueprint.post('/<path:name>')
def action(name=''):
    return get_response(NAME, name, routes, call_action)

Another route with a database connection is the following one:

from dbutils import transactional

from lib.db import get_db_from_conn, get_conn_from_dbname
from lib.decorators import use_schema, inject_conn
from settings import DEFAULT
from .schemas import FooSchema
from .sql import SQL_USERS


@use_schema(FooSchema)
@inject_conn(DEFAULT, named=True, autocommit=False)
def bar(conn, name, email=False):
    # Create new transaction from connection injected with a decorator
    with transactional(conn) as db:
        db.upsert('users', dict(email=email), dict(name=name))

    # Example of how to obtain new connection from database name.
    conn2 = get_conn_from_dbname(DEFAULT)
    db2 = get_db_from_conn(conn2)

    return db2.fetch_all(SQL_USERS, dict(name=name))

We can obtain our database connection in diverse ways. For example, we can use a function decorator to inject the connection (in this case the connection named DEFAULT) in the function signatura. We also can create the connection using a constructor. This connection is a raw psycopg2 connection. I also like to use a library to help me to work with psycopg2: a library (https://github.com/gonzalo123/dbutils) created by me a long time ago.

And that’s all. I normally deploy it in production using a nginx as a reverse proxy and n replicas of my api. Logs are also ready to send to ELK using a filebeat.

version: '3.6'

x-logging: &logging
  logging:
    options:
      max-size: 10m


services:
  api:
    image: dbapi:production
    <<: *logging
    deploy:
      replicas: 10
      restart_policy:
        condition: any
    volumes:
      - logs_volume:/src/logs
    environment:
      - ENVIRONMENT=production
    command: /bin/bash ./start.sh

  nginx:
    image: nginx-dbapi:${VERSION}
    deploy:
      restart_policy:
        condition: any
    environment:
      ENVIRON: ${VERSION}
    ports:
      - ${EXPOSED_PORT}:8000
    depends_on:
      - api

volumes:
  logs_volume:

Source code in my github account

Using a nginx reverse proxy to serve docker swarm replicas

Sometimes we need to serve backend servers behind a nginx reverse proxy. For example when we want to serve a Djnago or a Flask application. In this example I want to show how easy is doing that with nginx.

We’re going to start with a dummy Flask application.

from flask import Flask
from datetime import datetime

app = Flask(__name__)

@app.get("/")
def home():
    now = datetime.now()
    return f'Hello {now}'

The idea is use a nginx reverse proxy to serve the application. We can configure nginx to do that like this:

upstream loadbalancer {
    server backend:5000;
}

server {
    server_tokens off;
    client_max_body_size 20M;
    location / {
        proxy_pass http://loadbalancer;
    }
}

And finally we can create our docker-compose.yml file. We only need to set up the replicas and the reverse proxy will do the magic.

version: '3.6'

services:
  nginx:
    image: nginx:production
    ports:
      - "8080:80"
  backend:
    image: flask:production
    deploy:
      replicas: 3
    command: gunicorn -w 1 app:app -b 0.0.0.0:5000

As we can see we have 3 replicas behind a nginx reverse proxy. Maybe it’s enough for us, but maybe we need to distinguish between the replicas, for example in the logging.

(venv) ➜  docker stack services loadbalancer
ID             NAME                    MODE         REPLICAS   IMAGE              PORTS
u5snhg9tysr0   loadbalancer_backend    replicated   3/3        flask:production
4w0bf8msdiq6   loadbalancer_nginx      replicated   1/1        nginx:production   *:8080->80/tcp 

I’ve changed a little bit our Flask application.

import logging
from datetime import datetime
import socket
import os
from logging.handlers import TimedRotatingFileHandler

from flask import Flask

handlers = [
    logging.StreamHandler()
]
if os.getenv('ENVIRONMENT') == 'production':
    slot = os.getenv('SLOT')
    log_path = f"./logs/log{os.getenv('SLOT')}.log"

    file_handler = TimedRotatingFileHandler(log_path, backupCount=2)
    file_handler.setLevel(logging.INFO)
    handlers.append(file_handler)

logging.basicConfig(
    format=f'%(asctime)s ({socket.gethostname()}) [%(levelname)s] %(message)s',
    level='INFO',
    handlers=handlers,
    datefmt='%d/%m/%Y %X'),

logger = logging.getLogger(__name__)

app = Flask(__name__)


@app.get("/")
def home():
    now = datetime.now()
    logger.info(f"home {now}")
    return f'Hello {now} from {socket.gethostname()}. Slot: {os.getenv("SLOT")}'

And of course our docker-compose.yml file.

version: '3.6'

services:
  nginx:
    image: nginx:production
    ports:
      - "8080:80"
  backend:
    image: flask:production
    hostname: "backend.{{.Task.Slot}}"
    environment:
      SLOT: "{{.Task.Slot}}"
      ENVIRONMENT: production
    volumes:
      - log:/src/logs
    deploy:
      replicas: 3
    command: gunicorn -c gunicorn.conf.py -w 1 app:app -b 0.0.0.0:5000
volumes:
  log:
    name: 'log-{{.Task.Slot}}'

Now we’ve changed the hostname of the backend service using the slot number (instead of the default hostname). We also pass a SLOT environment variable to the backend service to distinguish between the replicas, if wee need to do that. Maybe you’re asking yourself, why the hell we need to do that? The answer ins simple: Working with legacy code is hard and sometimes we need to do very stranger things.

Source code of the example in my github

Listen to PostgreSQL events with pg_notify and Python

With PostgreSQL we can easily publish and listen events from one connection to another. It’s cool because those notifications belong on a transaction. In this example I’m going to create a wrapper to help me to listen the events with Python.

To notify events I only need to use pg_notify function. For example:

select pg_notify('channel', 'xxx')

To listen the events

import psycopg2

from pg_listener import on_db_event

dsn = f"dbname='gonzalo123' user='username' host='localhost' password='password'"

conn = psycopg2.connect(dsn)
conn.set_isolation_level(psycopg2.extensions.ISOLATION_LEVEL_AUTOCOMMIT)

for payload in on_db_event(conn, 'channel'):
    print(payload)

The magic resides in on_db_event. We need to pass a psycopg2 connection, and the channel name. We can iterate over the function and retrieve the payload when someone triggers the event on that channel

def on_db_event(conn: connection, channel: str):
    with conn:
        with conn.cursor() as cursor:
            cursor.execute(f"LISTEN {channel};")
            logger.info(f"Waiting for notifications on channel '{channel}'.")

            while True:
                if select.select([conn], [], [], 5) != ([], [], []):
                    conn.poll()
                    while conn.notifies:
                        notify = conn.notifies.pop(0)
                        yield notify.payload

As I often use Django and Django uses one connection wrapper I need to create a native psycopg2 connection. Maybe it’s possible to retrieve it from Django connection (show me if you know how to do it).

def conn_from_django(django_connection):
    db_settings = django_connection.settings_dict
    dsn = f"dbname='{db_settings['NAME']}' " \
          f"user='{db_settings['USER']}' " \
          f"host='{db_settings['HOST']}' " \
          f"password='{db_settings['PASSWORD']}'"

    conn = psycopg2.connect(dsn)
    conn.set_isolation_level(ISOLATION_LEVEL_AUTOCOMMIT)

    return conn

You can install the library using pip

pip install pglistener-gonzalo123

Source code available in my github

Playing with gRPC and Python

When we work with microservices normally we need to have, in one way or another, something to communicate between them. Basically we have two choices: Synchronous (APIs) and asynchronous communications (message queues). REST APIs are a pretty straightforward way to create a communication channel. We’ve a lot of frameworks and microframeworks to create REST APIs. For example, in Python, we can use Flask. REST is simple, and it can fit in a lot of cases but sometimes is not enough. REST API is a HTTP service and HTTP is a protocol built over TCP. When we create a REST connection we’re opening a TCP connection to the server, we send the request payload, we receive the response, and we close the connection. If we need to perform a lot of connections maybe we can face a bottleneck. Also we have the payload. We need to define how we’re going to encode the information. We normally use JSON (we also can use XML). It’s easy to encode/decode JSON in almost all languages but JSON is plain text. Big payloads over TCP connection means slow response time.

To solve this situation we’ve another tool in our toolbox. This tool is gRPC. With gRPC we create a persistent connection between client and server (instead of open and close connection like REST) and also we use a binary payload to reduce the size improving the performance.

First we need to define the protocol we’re going to use. It’s something that we don’t need to do in with HTTP APIs (we use JSON and we forget the rest). It’s an extra step. Not complicated, but an extra. We need to define the types of our service and variables using a proto file.

// api.proto
syntax = "proto3";
package api;

service Api {
  rpc sayHello (HelloRequest) returns (Hello) {}
  rpc getAll (ApiRequest) returns (api.Items) {}
  rpc getStream (ApiRequest) returns (stream api.Item) {}
}

message ApiRequest {
  int32 length = 1;
}

message Items {
  repeated api.Item items = 1;
}

message Item {
  int32 id = 1;
  string name = 2;
}

message HelloRequest {
  string name = 1;
}

message Hello {
  string message = 1;
}

With our proto file (language agnostic) we can create a the wrapper of our service using our programming language. In my case python:

python -m grpc_tools.protoc -I./protos --python_out=. --grpc_python_out=. ./protos/api.proto

Of course we can create clients using one language and servers using another. Both using the same proto file.

It creates two files. We don’t need to open those files. We’ll import those files to create our client and server. We can use those files directly but I preffer to use an extra wrapper. Without reinventing the wheel only to make me easy to use the client/and server.

import grpc

from api_pb2 import Items, Item, Hello, HelloRequest, ApiRequest
from api_pb2_grpc import ApiServicer, ApiStub


class ApiServer(ApiServicer):
    def getAll(self, request, context):
        data = []
        for i in range(1, request.length + 1):
            data.append(Item(id=i, name=f'name {i}'))
        return Items(items=data)

    def getStream(self, request, context):
        for i in range(1, request.length + 1):
            yield Item(id=i, name=f'name {i}')

    def sayHello(self, request, context):
        return Hello(message=f'Hello {request.name}!')


class ApiClient:
    def __init__(self, target):
        channel = grpc.insecure_channel(target)
        self.client = ApiStub(channel)

    def sayHello(self, name):
        response = self.client.sayHello(HelloRequest(name=name))
        return response.message

    def getAll(self, length):
        response = self.client.getAll(ApiRequest(length=length))
        return response.items

    def getStream(self, length):
        response = self.client.getStream(ApiRequest(length=length))
        return response

Now I can create a server.

import logging
from concurrent import futures

import grpc

import settings
from api import ApiServer
from api_pb2_grpc import add_ApiServicer_to_server


def serve():
    server = grpc.server(futures.ThreadPoolExecutor(max_workers=10))
    add_ApiServicer_to_server(ApiServer(), server)
    server.add_insecure_port(f'[::]:{settings.BACKEND_PORT}')
    server.start()
    server.wait_for_termination()


if __name__ == '__main__':
    logging.basicConfig()
    serve()

And also a client. In my example I’m going to use a flask frontend that consumes the gRPC server

from flask import Flask, render_template

import settings
from api import ApiClient

app = Flask(__name__)

app.config["api"] = ApiClient(f"{settings.BACKEND_HOST}:{settings.BACKEND_PORT}")


@app.route("/")
def home():
    api = app.config["api"]
    return render_template(
        "index.html",
        name=api.sayHello("Gonzalo"),
        items=api.getAll(length=10),
        items2=api.getStream(length=5)
    )

We can deploy the example in a docker server. Here the docker-compose.yml

version: '3.6'

services:
  frontend:
    build:
      context: .
      dockerfile: Dockerfile
    environment:
      BACKEND_HOST: backend
    ports:
      - 5000:5000
    command: gunicorn -w 4 app:app -b 0.0.0.0:5000
  backend:
    build:
      context: .
      dockerfile: Dockerfile
    command: python server.py

Source code available in my github

Handling M1 problems in Python local development using Docker

I’ve got a new laptop. One MacbookPro with M1 processor. The battery performance is impressive and the performance is very good but not all are good things. M1 processor has a different architecture. Now we’re using arm64 instead of x86_64.

The problem is when we need to compile. We need to take into account this. With python I normally use pyenv to manage different python version in my laptop and I create one virtualenv per project to isolate my environment. It worked like a charm, but now I’m facing problems due to the M1 architecture. For example to install a specific python version with pyenv I need to compile it. Also when I install a pip package and it provides a binary it must be available the M1 version.

This kind of problems are a bit frustrating. Apple provide us rosetta to use x86 binaries but a simple pip install xxx turns into a nightmare. For me, it’s not assumable. I want to deploy projects to production not become an expert in low level architectures. So, Docker is my friend.

My solution to avoid this kind of problems is Docker. Now I’m not using pyenv. If I need a python interpreter I build a Docker image. Instead of virtualenv I create a container.

PyCharm also allows me to use the docker interpreter without any problem.

That’s my python Dockerfile:

FROM python:3.9.6 AS base

ENV APP_HOME=/src
ENV APP_USER=appuser

RUN groupadd -r $APP_USER && \
    useradd -r -g $APP_USER -d $APP_HOME -s /sbin/nologin -c "Docker image user" $APP_USER

WORKDIR $APP_HOME

ENV TZ 'Europe/Madrid'
RUN echo $TZ > /etc/timezone && \
apt-get update && apt-get install --no-install-recommends \
    -y tzdata && \
    rm /etc/localtime && \
    ln -snf /usr/share/zoneinfo/$TZ /etc/localtime && \
    dpkg-reconfigure -f noninteractive tzdata && \
    apt-get clean

RUN pip install --upgrade pip

FROM base

ENV PYTHONDONTWRITEBYTECODE 1
ENV PYTHONUNBUFFERED 1

WORKDIR $APP_HOME

COPY requirements.txt .
RUN pip install -r requirements.txt

ADD src .

RUN chown -R $APP_USER:$APP_USER $APP_HOME

USER $APP_USER

I can build my container:

docker build -t demo .

Now I can add interpreter in pycharm using my demo:latest image

If I need to add a pip dependency i cannot do using pip install locally. I’ve two options: Add the dependency within requirements.txt and build again the image or run pip inside docker container ("with docker run -it –rm …"). To organize those script we can easily create a package.json file.

{
  "name": "flaskdemo",
  "version": "1.0.0",
  "description": "",
  "main": "index.js",
  "scripts": {
    "test": "echo \"Error: no test specified\" && exit 1",
    "docker_local_build": "docker build -t $npm_package_name .",
    "freeze": "docker run -it --rm -v \"$PWD\"/src:/src $npm_package_name python -m pip freeze > requirements.txt",
    "local": "npm run docker_local_build && npm run freeze",
    "python": "docker run -it --rm -v $PWD/src:/src $npm_package_name:latest",
    "bash": "docker run -it --rm -v $PWD/src:/src $npm_package_name:latest bash"
  },
  "author": {
    "name": "Gonzalo Ayuso",
    "email": "gonzalo123@gmail.com",
    "url": "https://gonzalo123.com"
  },
  "license": "MIT"
}

Extra

There’s another problem with M1. Maybe you don’t need to face it but if you build a docker container with a M1 laptop and you try to deploy this container in linux server (not a arm64 server) your containers doesn’t work. To solve it you need to build your containers with the correct architecture. Docker allows us to do that. For example:

docker buildx build --platform linux/amd64 -t gonzalo123/demo:prodution .

https://github.com/gonzalo123/docker.py